chart
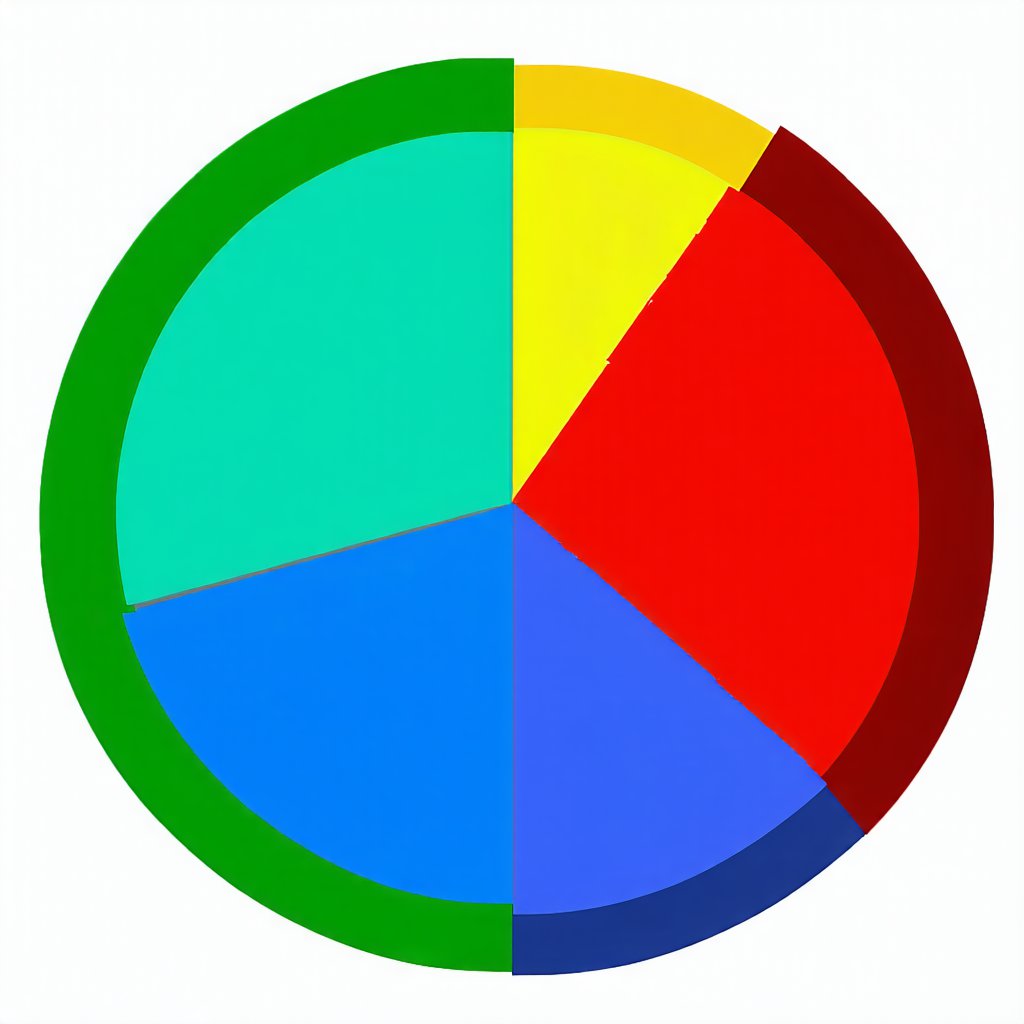
Think of a chart like a special drawing that helps us understand things better. Imagine you have a big box of crayons, and you want to show your friends which colors you use the most. You could make a chart by drawing bars, where each bar is a different color from your crayon box. The taller the bar, the more you use that color. This way, your friends can see your favorite colors just by looking at the chart. Now, imagine you have a collection of toy cars, and you want to show how many cars you have of each color. You can use a pie chart, which looks like a big pie cut into slices. Each slice is a different color, and the bigger the slice, the more cars you have of that color. It’s like showing your toy car collection in a yummy pie!
 Another way to think about a chart is like a map for information. Just like a treasure map shows where the treasure is, a chart shows where the important information is. It helps you find answers quickly by organizing everything in a way that’s easy to see and understand.